Genetic progress delivered from the Elite Farms to the commercial level creates economical benefits for pork producers. The faster genetic progress is transferred down the pyramid, the more economically beneficial it is for producers as genetic lag is being reduced.
 PIC’s genetic improvement originates in PIC’s Elite Farms and is then transmitted to commercial pigs through reproduction. “Genetic Lag” is the KPI to measure the time it takes to deliver the genetic improvement from the Elite Farms to the commercial level, usually shown years. Genetic lag mainly depends on the generation interval. Genetic progress from the Elite Farms has to be passed down the line – from GGPs (greatgrandparents) to GPs (grandparents) and finally to the parents of the commercial slaughter pig.
The reproductive cycle of pigs determines the existence of a genetic lag. However, if we can improve the efficiency in transferring the genetic progress, producers experience the genetic improvement in their operations faster, thereby increasing the efficiency of the entire production system and profitability: higher weight gain, higher piglet survival at all stages of production, more piglets born, lower feed conversion and etc.
Genetic progress in PIC’s Elite Farms is quite fast due to a high herd replacement rate, consistent selection of high-indexed GGPs and GPs combined with state-of-the-art technologies, such as genomic selection and GNXbred program.

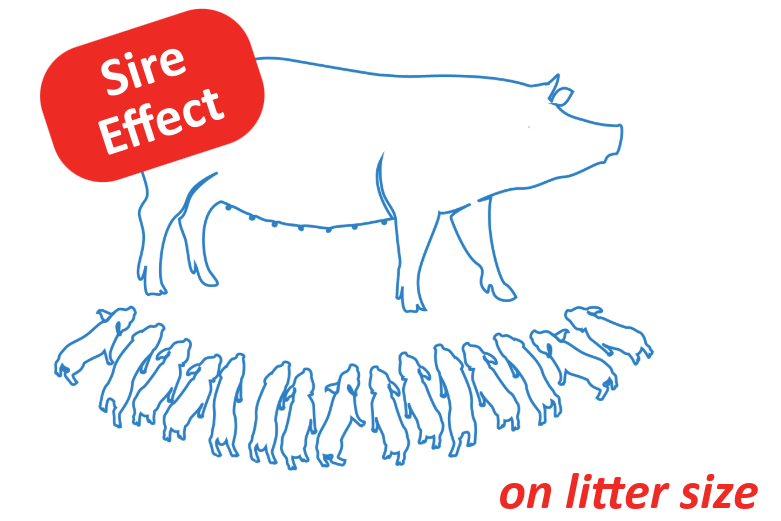
A terminal boar contributes 50% of his genetic merit to the genetic potential of a commercial pig. Consequently, speeding up the transfer of genetic improvements from Elite Farm level to GTC managing terminal boars will increase the economic value significantly. We recommended to have an annual replacement rate for terminal boar of at least 70%.
The following model of three different scenarios for boar replacement (high, medium and low level) demonstrates the impact of replacement rate of terminal boars on production profitability.
| High level | Medium level | Low level | |
|---|---|---|---|
| Replacement rate, % | 75% | 60% | 45% |
| Ø Boar Index | 110 | 100 | 90 |
| Selection accuracy, % | 50% | 35% | 20% |
| Number of deliveries | 6 | 4 | 2 |
Selection index describes the value of a boar
The economic value of a boar is described by the boar’s index. Selection index is not just a figure, this is an indicator of breeding value of the animal, which we can convert either into monetary value or into specific performances of the animal which we include into selection objectives.
The calculation of value of one index point includes the economic value (MEV) and the genetic component (EBV).
The Estimated Breeding Value (EBV) describes the deviation from the average of the population for each specific trait. PIC calculates the average from the animals of each line off-tested during the last 24 months (rolling base). PIC estimates the EBVs on a weekly basis from any PIC breeding pig managed in PIC’S database PICTraq globally.
The second component of the index is the economic value of each trait. The Marginal Economic Value (MEV) describes how much a one-unit increase in performance for the trait contributes to profits.
Therefore it becomes clear why an index is not just a figure but represents the level of genetic value of an animal, which can be translated into money or into performance. Combining MEVs and EBVs and adding them up result in an index value – the total economic potential of an animal.

Higher index = higher profit potential
For damlines we calculate a Value of One Index Point (VOIP) of 3.5p and for terminal lines each index point values 6.5p.
The increase by X index points is linked to a life-time potential profitability of the boar, means, increase by for example 20 index points will potentially increase profitability of one slaughter pig by £ 1.30. Referring to the above mentioned levels of replacement rates at a boar stud shows that these 20 points difference in index represents the difference between the high and the low scenario.
This means for a commercial sow farm with 1,000 sows producing 30,000 pigs per year: Applying a higher replacement rate and using terminal boars with an index 20 point above average increases the profit potential by 30,000 pigs x £1.30 = £39,000.
It is also worth noting a very important point – genetic progress has a cumulative effect.
Contact your PIC Team to lean more about Profit Potential.